ICPAC Launches Drought Watch System
First of its kind in Africa
by Grace Miswa, Viola Otieno, Erick Otenyo and Marta Baraibar
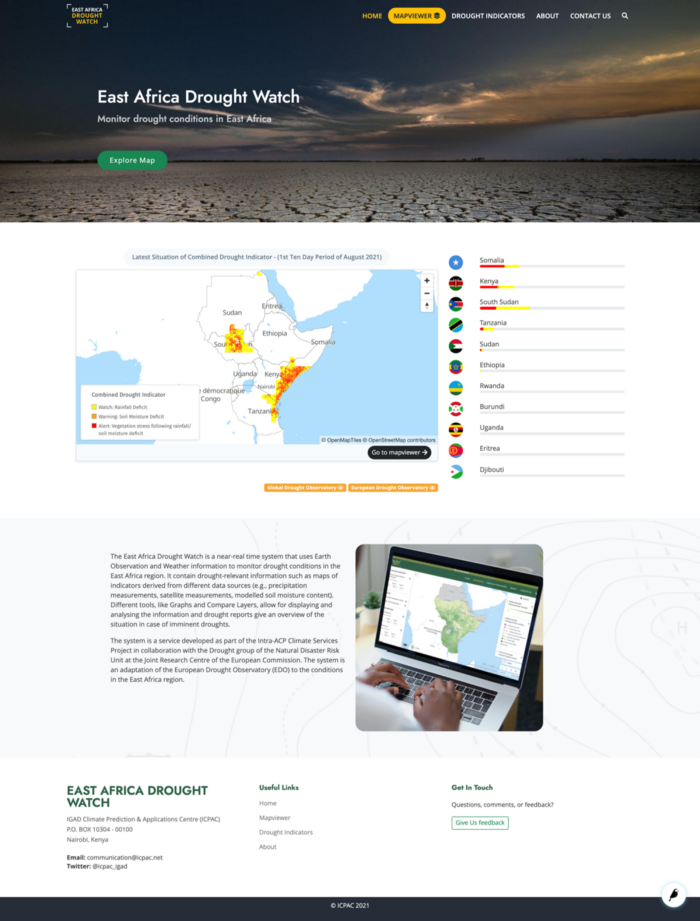
The East Africa Drought Watch (https://droughtwatch.icpac.net/) is the very first public transboundary system that uses near-real-time Earth Observation and Weather Information to monitor drought conditions in a region in Africa.
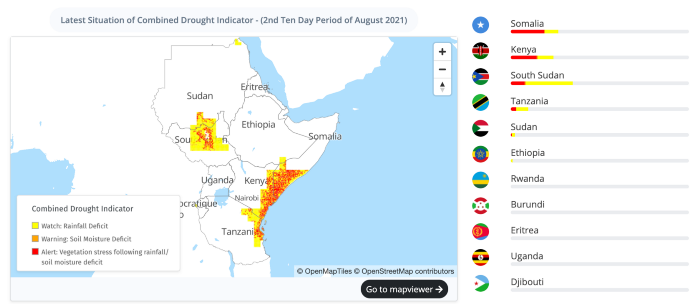
The system contains colour coded drought risk information by country and allows users to generate their own analysis and reports containing time series of visual information (e.g. drought risk, precipitation, vegetation, soil moisture). The system contains tools to allow users to assess the drought situation and the risk that current conditions pose to livelihoods. It allows for the user-friendly generation of graphs, maps, time series and will soon allow users to subscribe to receive email reports.
The system is built using Open Source technologies offering opportunities for scalability, flexibility, transparency and sustainability.
Drought has always been a well known and recurrent problem in Eastern Africa. The region is made up of more than 60% of arid and semi-arid lands (ASALs), and prone to frequent and severe droughts. The population of the region is considered to be among the most vulnerable in Africa. In the past droughts led to some of the worst humanitarian crises of the 20th century, such as the Famine that affected Ethiopia and Sudan in the 80’. The severe droughts in Ethiopia in 1973 and 1983 caused a total of 400,000 deaths and 150,000 deaths in Sudan in 1983. Just 10 years ago, in 2011, it is estimated that up to 260,000 people died because of drought.
Climate Change and environmental degradation are exacerbating the risks posed by Droughts. The region is already affected by chronic vulnerability, with persistent food and nutrition insecurity, widespread economic and social hardships, conflict and displacement.
Having functional public, transboundary Early Warning systems for Drought monitoring, and building them by making use of the latest technologies is key to increase the coping capacity of the populations of the region and their resilience to increasing climate extremes.
The system is able to generate time series analysis reports containing charts, and maps centred around a user-defined point. Development is well underway to extend this analysis for an administrative boundary.
The development of the system is currently ongoing with plans to integrate periodic products disseminated as comprehensive reports to subscribed users, provide additional thematic datasets, perform drought forecasting, translate system warnings into impact-based information/warnings among other plans.
Here are some of the layers that you will find
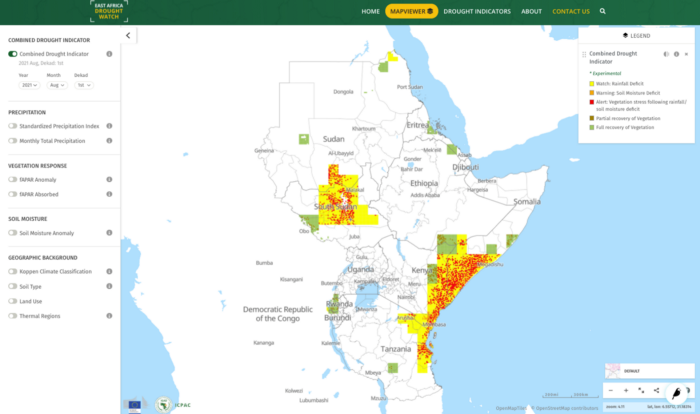
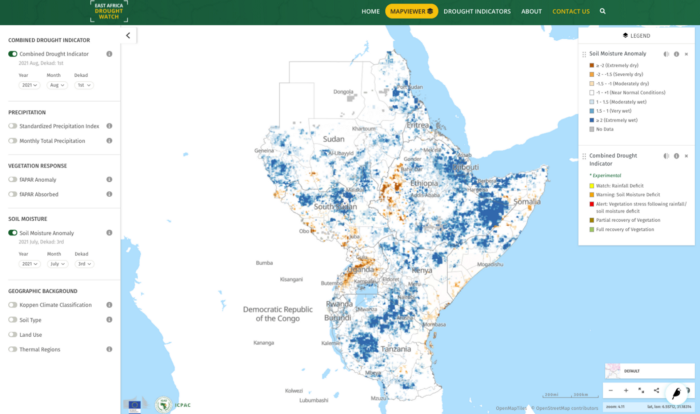
The Combined Drought Indicator, based on The SPI (Standardized Precipitation Index), SMA (Soil Moisture Anomaly) and FAPAR Anomaly (Fraction of Absorbed Photosynthetically Active Radiation), identifies areas with potential to suffer agricultural drought, areas where the vegetation is already affected by drought conditions, and areas in recovery process to normal conditions after a drought episode. This indicator has been integrated into the East Africa Hazards Watch. This layer is currently experimental and plans are well underway to further customize and strengthen this indicator for the region. Know more.
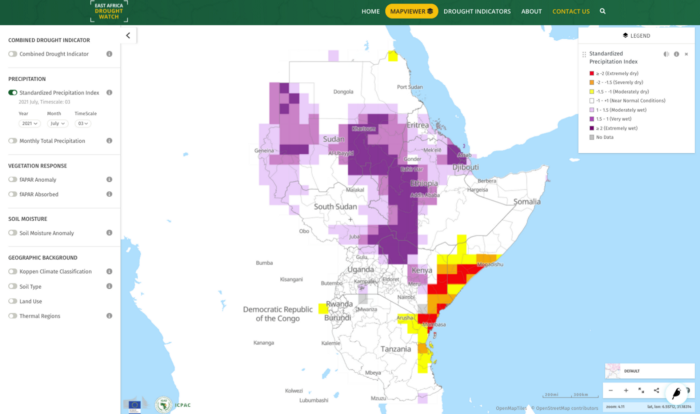
The system supports monitoring anomalies of accumulated precipitation during a given period (e.g., 1, 3, 12 months). The Standardized Precipitation Index (SPI) is used for characterizing meteorological droughts. Know more about this layer.
Furthermore, the Soil Moisture Anomaly (SMA) determines the start and duration of agricultural drought conditions, which arise when soil moisture availability to plants drops to such a level that it adversely affects crop yield, and hence, agricultural production. Know more.
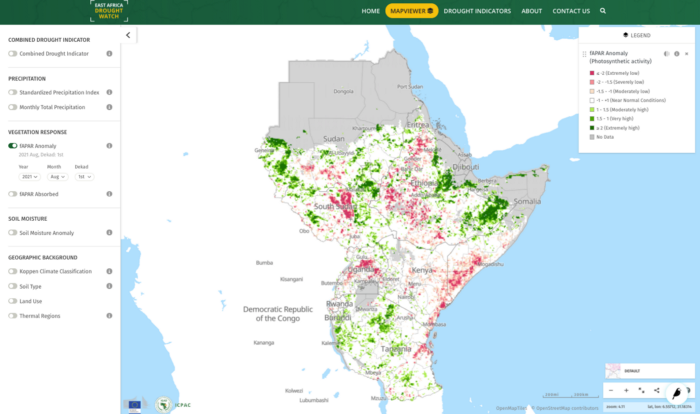
The impacts of agricultural drought on the growth and productivity of vegetation can be detected and monitored using the FAPAR Anomaly indicator. This indicator is computed as deviations of the satellite-measured biophysical variable Fraction of Absorbed Photosynthetically Active Radiation (FAPAR, sometimes written as fAPAR or FPAR). Know more.
Explore East Africa Drought Watch and give us your feedback
Note: The system is a service developed as part of the Intra-ACP Climate Services Project in collaboration with the Drought group of the Natural Disaster Risk Unit at the Joint Research Centre of the European Commission. The system is adopted from the European Drought Observatory and adapted to the conditions in the East Africa region.